Study by Portland State University Transportation Engineering Students
Chris Goya
Pamela Johnson
Peter Reich
As part of course CE 462, Traffic Engineering Applications and Signal Timing, adjunct professor and manager of the Signals and Timing at the Portland Bureau of Transportation, Peter Koonce, assigned students to design solutions for specific downtown Portland intersections and streets. The focus of the study was to improve pedestrian accessibility and safety. More than just making pedestrian travel better than it is today, the goal of the project was to prioritize pedestrian travel and to encourage its use by making it an easier and more attractive mode of transportation through improving intersection design and signal timing.
Introduction
According to the Signal Timing Manual, prepared for the Federal Highway Administration by Kittleson & Associates, “The primary objective of signal timing settings is to move people through an intersection safely and efficiently.” There is a close relationship between intersection design and signal timing. Intersection design directly affects the safety of the user. When designing the intersection and signal timing, perception and reaction times of the users needs to be intrgrated (p.1-2).
Transportation systems, intersection design and signal timing are a direct result of government policies, from the Federal to the local level. Transportation systems are a major part of our society and affects how regions, cities, towns, and communities function and develop. All people are influenced and depend on the quality of their transportation system (p. 2-1).
In Portland, the Central City Transportation Management Plan (CCTMP) directly influences the design of intersections and signal timing. The CCTMP is part of the Portland planning process with goals that include improving livability, increasing compact development, and improving air quality. Both general zoning laws as well as specific projects for improvement are provided in the plan. A list of specific goals are given such as increasing mass transit use through the core of the city by 75 percent, “Promote the use of bicycles as an alternative mode of transportation”, and “Give maximum accommodation to walking in the core.”
In order to further the goals of the Portland’s CCTMP, our group researched existing conditions and recommended improvements to the intersection geometry and signal timing at West Burnside Avenue and 3rd Street. We also looked at 12th Avenue south and north of West Burnside and made some suggestions for improving bike and pedestrian travel along the this corridor.
Major Project: The Intersection of West Burnside and 3rd Avenue
Portland is divided north and south by Burnside Street. The Willamette River divides the City into its west and east distinctions. Downtown Portland is on the west bank of the Willamette River. The intersection of West Burnside and 3rd Avenue, situated near the intersection of the Burnside Street and the Willamette River, places this intersection in the heart of Portland. On the south side of the intersection is Downtown. The north side of Burnside Street is considered Old Town and is also part of Portland’s China Town.
History
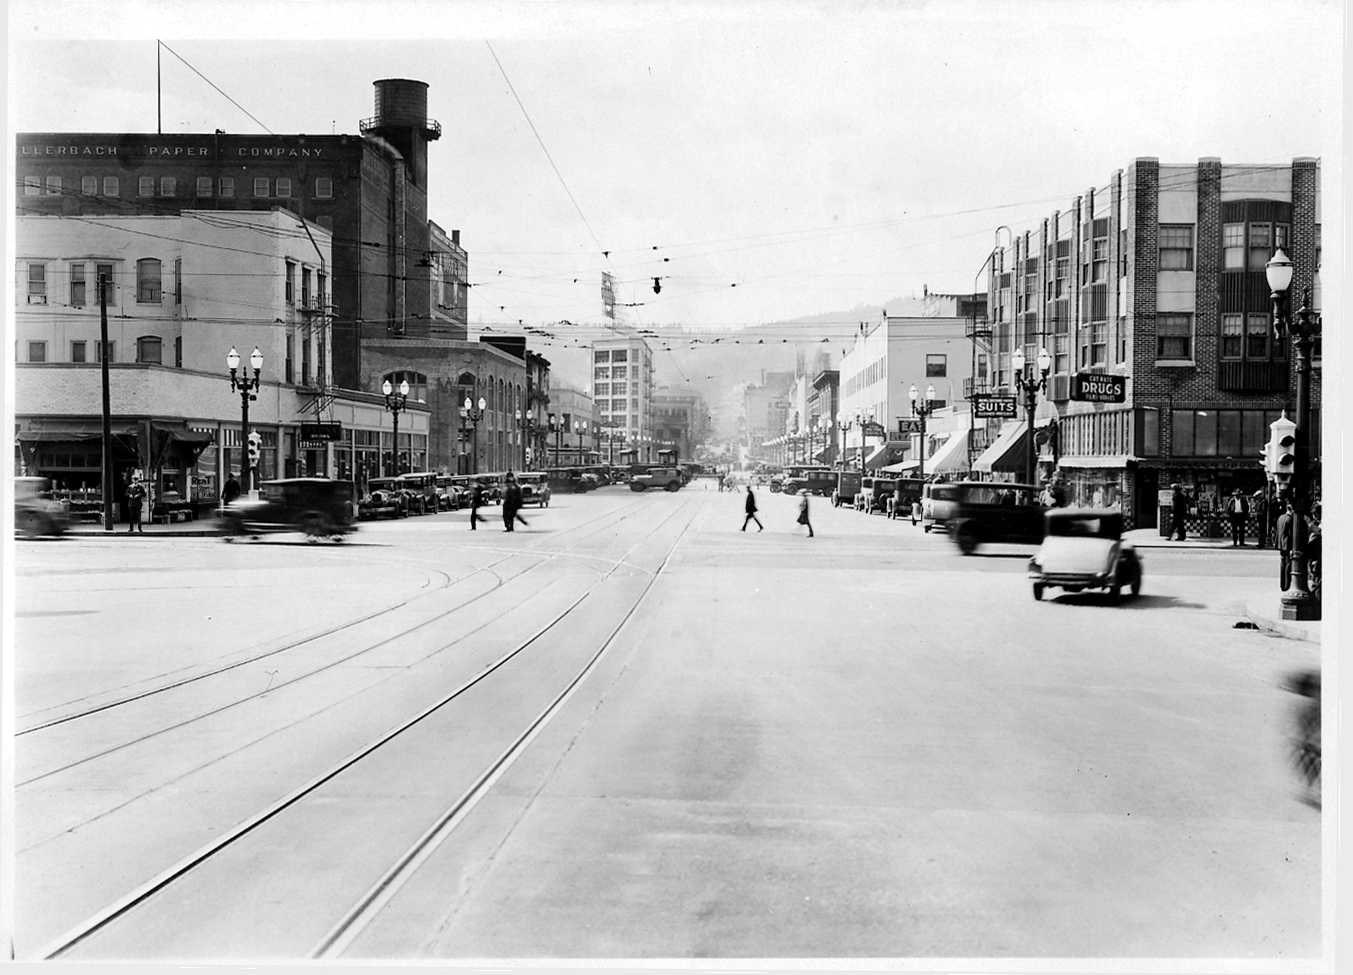
In 1933 Burnside was widened to accommodate the growing use of automobiles.

Figure 1: West Burnside Street and 3rd Avenue Before Widening, 1933
http://vintageportland.files.wordpress.com/2010/05/a2001-062-6-west-on-burnside-from-3rd-before-widening-1933.jpghttp://vintageportland.wordpress.com/2010/05/25/w-burnside-at-3rd-before-widening/

Figure 2: West Burnside Street and 3rd Avenue After Widening, 1933
Today

Figure 3: West Burnside and 3rd
Today, West Burnside Street is a major arterial in downtown Portland. The Burnside Bridge crosses the Willamette River two blocks to the east. The Burnside Bridge has a bike path and it is also used by many pedestrians.
The area around West Burnside and 3rd Avenue has a diverse mix of nightclubs, restaurants, and alternative businesses. It is also the center of social services and charities. The popular Portland Saturday Market is just two blocks away from West Burnside Street and 3rd Avenue. Recently, SW Ankeny Street, between 3rd and 2nd, has been closed off to vehicle traffic in order to promote pedestrian use.
Although there are many successful businesses in the area, there are also abandoned storefronts and empty lots. It is a bustling area during most parts of the day, with a diverse mix of pedestrians including young adults, seniors, families, and tourists.
At the intersection, West Burnside is a 5 to 6 lane street with a 10 foot wide landscaped median. Left turns are prohibited from West Burnside Street. 3rd Avenue is a three lane, one-way street heading south into Downtown. No bike lanes are provided on either street.

Figure 4: West Burnside and 3rd Avenue and Southwest Ankeny and 3rd Avenue
Research and Data collection
On site data was collected during peak AM hours between 7:30 and 8:30, PM peak between 4:30 and 5:30, and also during off peak hours between 10 and 11 AM. Data collection included;
· Hourly pedestrian flow
· Pedestrian violators (jaywalkers)
· Pedestrian delay
· Vehicle delay
· Yellow and red times
· Saturation flow-rate
· Vehicle volumes
Hourly pedestrian flow was found by recording each pedestrian movement, NE to SE, NW to NE and so on, for one hour. Pedestrian violators or jaywalkers were recorded in the same manner. It should be noted that violators were only counted if they entered on a "Do-not-walk" or did not clear the intesection in time. Violators were not counted if they entered during "Flashing-don’t-walk" but cleared the intersection before "Do-not-walk" came up.
Both yellow and all red times were measured directly during the AM peak hour. Vehicle delay was averaged during the AM peak by starting a timer when the first vehicle was stopped by a red light, lapping the stopwatch when each additional car was delayed by the light, lapping the stopwatch again when each concurrent vehicle was allowed to proceed, and then finally subtracting the difference.
Saturation flow rate was measured by allowing a queue to develop on the approach in question, allowing 3 cars to proceed through a selected point of interest (middle of the intersection), and then counting how many cars passed that point in a timed reference. The counts were thrown away if large gaps were formed by slowly accelerating vehicles. Lastly, vehicle volumes were recorded by making vehicle counts during 15-minute increments.
Existing Intersection Geometry

Pedestrian Volumes
Saturation flow rate was measured by allowing a queue to develop on the approach in question, allowing 3 cars to proceed through a selected point of interest (middle of the intersection), and then counting how many cars passed that point in a timed reference. The counts were thrown away if large gaps were formed by slowly accelerating vehicles. Lastly, vehicle volumes were recorded by making vehicle counts during 15-minute increments.
Existing Intersection Geometry
Recently, improvements have been made to the pedestrian facilities on the north side of the West Burnside Street and 3rd Avenue intersection. Bulb-outs have been added in order to shorten the crossing time for pedestrians. But there are still many challenges at the intersection for pedestrians and cyclists.
The crossing distance on the improved north side of the intersection is 31 feet. The unimproved south side of the intersection has a pedestrian crossing width of over 76 feet. According to the Pedestrian Facilities User Guide, pedestrian clearance time recommendations are 3.5 feet per second. At 3.5 feet per second it would take 22 seconds to cross the south pedestrian crosswalk, compared to 9 seconds to cross the north side of the intersection.
Another problem with the south pedestrian crossing is that there is angled parking on the east side of 3rd Avenue. The angled parking blocks the pedestrians' field of vision and encourges waiting in the street at the rear of the cars parked in the angle parking. See Figure 4.
Another problem with the south pedestrian crossing is that there is angled parking on the east side of 3rd Avenue. The angled parking blocks the pedestrians' field of vision and encourges waiting in the street at the rear of the cars parked in the angle parking. See Figure 4.
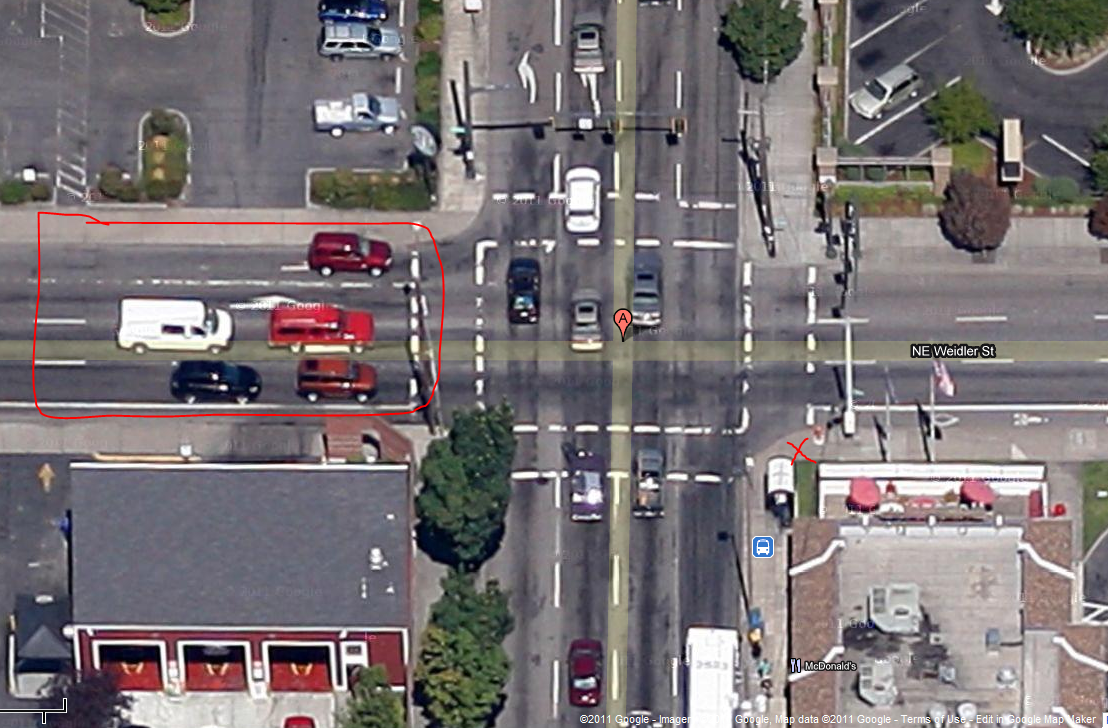
For cyclists on 3rd Avenue, there are no bike facilities. Left turn traffic is heavy at this approach for both cyclists and vehicles. Cyclists that want to turn left onto Burnside Street from 3rd Avenue use the left side of the left lane. This creates a conflict with cars because the cyclist must try to get on the right side of the turning car one on Burnside. See Figure 5.

Figure 5: Conflicts between Cyclists and Vehicles turning onto Burnside Street
West Burnside also has its challenges for pedestrians and cyclists. the entire crossing distance for pedestrians is close to 90 feet, which needs a 25 second pedestrian crossing time. Because of the high speed and high volume vehicle traffic on West Burnside Street, waiting at the median is uncomfortable for pedestrians. The geometry of the pedestrian crossing area on the east side of the intersection is also a problem, which is set back from the intersection. This setback fron the new bulb-out on the northeast corner confuses vehicle drivers about where to stop. Although the stop bar for vehicles is behind the pedestrian crossing, vehicles tend to stop at the new intersection bulb-out. See vehicles in at northeast corner in Figure 5.
For cyclists, there are no bike facilities along Burnside Street, although there are bike paths on the Burnside Bridge. Those cyclists considered to be “fearless”, which are not afraid to bike on streets with cars, were observed using all traffic lanes with cars on the east approach on Burnside Street. Cyclists that were turning left onto 3rd from the east approach on Burnside Street were using a variety of methods to cross the road, including;
· Turning left on green, although it is prohibited for cars
· Stopping at the northwest corner of 3rd to wait for the green light on 3rd
· Using the east crosswalk and then merging over to the right of 3rd Avenue
It was also observed that cyclists were taking u-turns on Burnside Street.
Pedestrian Volumes
 |
| Figure 6: Pedestrian AM Peak Volume |
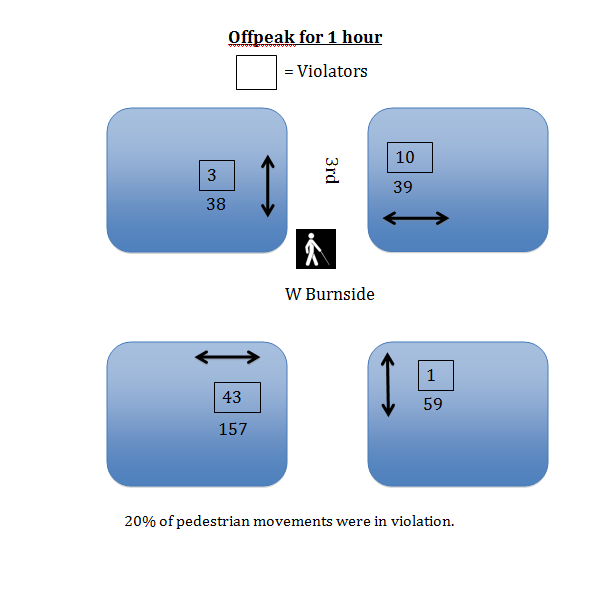 |
| Figure 7: Pedestrian Off Peak Volume |
 |
| Figure 8:Pedestrian PM Peak Volume |
Critical Movement Analysis


Crash Data


The following shows the costs being absorbed for pedestrian crashes in 2009 and 2010.
Fatal = $3,400,000
•A = $260,000
•B= $56,000
•C= $27,000
•PDO= $4,000
2010: $56,000(1) +$27,000(2) =$110,000
2009: $56,000
Recommendations
Based on our observations and data collection our recommendation is to make a number of changes to the geometry of the intersection, signals, and signal timing. West Burnside and 3rd Avenue is an exellent testing grounds for these innovative solutions for pedestrians and bike travel and accessibility.
Intersection Geometry
Changes to the intersection geometry include;
· A left turn only lane on the approaching 3rd Avenue.
· A new roundabout cycle path with bike box on the north approach. See detailed below.
· New large bulb-outs on the south leg of the intersection and a reduction of the south crosswalk to 24 feet
· The addition of bulb-outs and crosswalk on 3rd and Ankeny Street
· The creation of a northbound separated bike path and a widened sidewalk on the southeast block along 3rd Avenue
· Extension of the median refuges
· New zebra crosswalk striping
· Adding bike lanes and removing some parking on the east approach
· Reducing vehicle lanes on the south leg of the intersection
· Increase in width of the east pedestrian crossing zone
· Add bike signals for all directions and an exclusive bicycle split into the signal timing cycle.
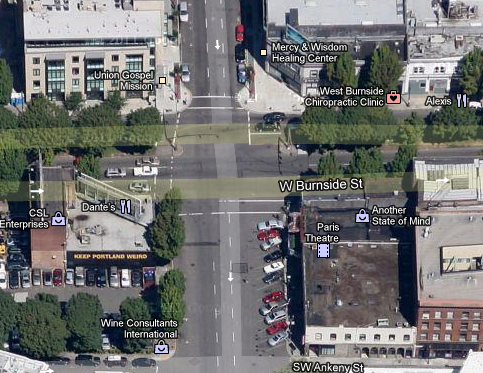
figure 9: Existing conditions

Figure 10: Recommended Intersection treatments on West Burnside and 3rd Avenue

Figure 11: Recommended Bike Signal
The bicycle roundabout
The bicycle roundabout concept for the intersection of West Burnside Street and 3rd Avenue has been recommended to solve the problem of cyclists taking dangerous left hand turns on the intersection of West Burnside Street and 3rd Avenue. This design creates a counterclockwise bike path that encourages safe left-hand turning movements for cyclists. See video link below. This solution also solves the bicycle safety issues for bike traffic from the Burnside Bridge by adding bike lanes onto Burnside Street.

Figure 12:Recommended Intersection Treatments and
Left Turns for Cyclists
Another innovative idea is that has been added to the south leg of the intersection is the two-way bike path on a one way street. This unique bike facility treatment has been recommended in order to encourage bike traffic to local businesses.
The following link is the result of a study done in California, that relates the safety of an intersection to the addition of a bike boulevard on an arterial.
CMF for adding a bike boulevard to an arterial:
http://www.cmfclearinghouse.org/study_detail.cfm?stid=221
http://www.cmfclearinghouse.org/study_detail.cfm?stid=221
Determining the plans for the signal timing arrangement on 3rd and Burnside was based on the current signal timing plans. There was a substantial amount of lost time on the minor approach (3rd Avenue) and some lost time on the major approach (Burnside Street). The arrivals on Burnside going west were random with vehicles driving different speeds over the Burnside Bridge. By understanding vehicle arrivals at 2nd Street the green time could be shortened to allow for more compact platoons. Tighter platoons would make the flow on Burnside Street approach saturation flow. The time taken from the minor and major approaches would be given to a new phase in the controller. The phase would allow some time for an exclusive bicycle split as well as give additional time for pedestrians crossing Burnside Street. It was estimated that 12 seconds would be needed for bicycles to cross two intersections in order to make a left turn on the cycle track. Within these 12 seconds, the flashing don’t walk (FDW) on Burnside Street will be 8 seconds to countdown to zero and show yellow for bicycles. The cycle would start on yellow for phases 2 & 6. With the exception of the weekends, the daily plans schedules in place are currently sufficient. The weekend night plan is too short of a cycle to allow for adequate bicycle movements.
The recommended change of the plan would be transition from a 70 second cycle length to an 80 second cycle length on weekend evenings. The additional time gives a longer green time for the exclusive bicycle split as well as giving additional time to the major approach. The green split for phases 4&7 are similar to the current conditions with a slightly shorter phase. The major change is the green time on Burnside, which can have a reduction of up to 14 seconds. These improvements will increase the efficiency of the intersection and will also increase the flow on Burnside Street, bringing it closer to the saturation flow rate. Adding an exclusive left turn off of 3rd will allow vehicles to queue and make a smooth and quick left turn onto Burnside Street. The left turn volumes off of 3rd are sufficient enough to receive some green time in the cycle. In the plans below the walk times for phases 2&6 are listed as 8 seconds. This would be the minimum time for the walk signal. The signal would be extended until 9 seconds before the associated phase’s force-off. There would be an overlap of walk and FDW for phases 4&8 and phase 9. In the controller, phase 8 would only receive a walk signal for the east most crossing of Burnside Street. Since phase 7 conflicts with phase 8, the walk signal for phase 8 will not be shown when phase 7 has a green. The current yellow and all red times on Burnside Street will stay the same for phases 2, 4, and 6. Phase 7 would not receive an all red time since phase 4 follows. The exclusive bicycle split will receive a yellow time which is the amount of time to finish any crossing of the intersection. The green split for phase 9 is 12 seconds. Embedded in the 12 seconds is 8 seconds for the finishing of pedestrian movements across Burnside Street.


Minor Project: 12th Avenue around West Burnside Street
The purpose of the minor project was to make recommendations based on observations of the area to improve pedestrian traffic flow along 12th Avenue, north and south of West Burnside Street.
12th Avenue is a one way street on the south side of West Burnside Street. On the north side of West Burnside Street 12th is again a one way street heading north for two more blocks and then it becomes a two way street at Davis Street.
Our recommendation is to extend the one way configuration of the street on 12th Avenue heading north towards the Pearl District, minimize the vehicle lane from two to one lane, and add a cycle track. As part of this solution, 13th would also need to be converted to a one way street heading south to form a couple.
13th can also be easily converted to a south bound one way with a cycle track. Like 12th Avenue, it is a oneway street along a large portion of the area through Downtown. See examples of the converted streets below.
Although this solution does not address pedestrians directly, a decrease in vehicle lanes to one and adding cycle track will calm traffic and increase the attraciveness of the area for pedestrians.
  |
SW 12th Avenue and Stark Street |


SW 12th Avenue and Burnside Street


NW 12th Avenue and Burnside Street


NW 12th Avenue and Couch Street


NW 12th Avenue and Davis Street


NW 13th Avenue and Davis Street


NW 13th Avenue and Everett Street
