Homework 2.1.1 and 2.1.3
Pamela Johnson
Chris Goya
Peter Reich
What is the capacity of a single lane of traffic?
According to a summary by James B. Michael titled Capacity Analysis of Traffic Flow over a Single-Lane Automated Highway System (1998), Capacity is constrained by the minimum inter-vehicle separation necessary for safe operation. The capacity of a single lane is the measurement of how many cars pass a reference point in one hour during peak flow conditions. This also includes traffic from conflicting lanes of traffic. In other words, capacity only looks at a point, and is not concerned how a vehicle reaches that point. The point that has the largest demand of traffic is the capacity that is used to determine the green time. Traffic does not flow steadily for one hour, therefore trying to find a solid hour under these conditions is impossible. The capacity is extrapolated by finding the headway of the cars at a point of interest during steady saturated flow and dividing 3600 by the headway.Measure the flow at a busy intersection for 15 minutes. Describe your observations.
*see excel attachment for collected data, headways, and capacities.
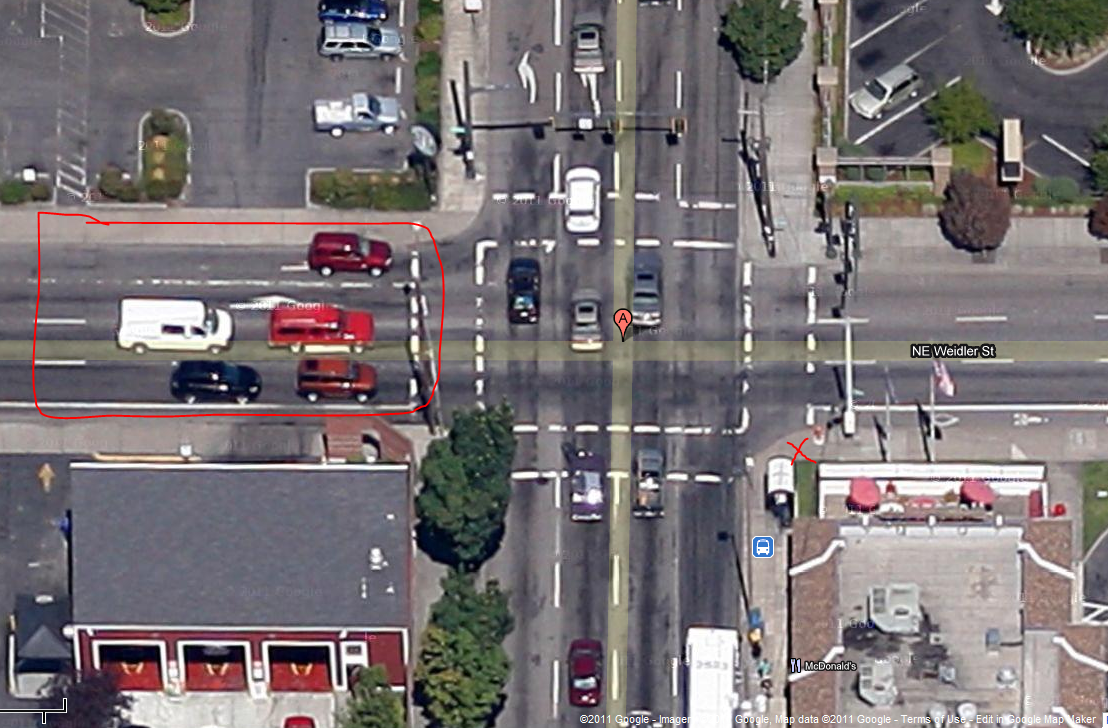 |
Figure 1: The intersection of NE Weidler Street and NE Grand Avenue |
Observations and data collection were made at the corner of NE Weidler Street and NE Grand Avenue on Sunday, July 24 at approximately 12:30 PM. Data was collected on the three right most lanes of the eastbound approach of Weidler Street as shown in Figure 1. Although the observations were made on a Sunday, this intersection was being used to its full capacity. Weidler Street has one left turn lane, one shared through-left turn lane, and two through lanes. Grand Avenue, the intersecting street, is a one way heading north. It has three through lanes and one shared through-right turn lane. Both streets have new streetcar tracks that will be used in the future.
Data was collected from fourteen consecutive signal cycles on the 3 right most lanes. The start of the green time, the end of the green time, the number of cars, the number of bikes, and the time it took for the queue to clear were all recorded. The distance between the preceding eastbound intersection to the one being examined allowed for a 6 car queue. Before the signal changed at Grand Avenue, cars from the preceding intersection joined the queue. This created a grey area as to where the queue ended. For the right lane, the queue never ended at this busy intersection, therefore the queue never cleared before the green time ended.
How much time is necessary between successive vehicles in a traffic stream at a signalized intersection?
According to the data collected in this observation, the average headway of the two through lanes is 2.4 seconds.
The shortest time for a vehicle’s gap at a signalized light is about 2.5 seconds. In the downtown area the gap should be a little bigger to make time for the turns with many driveways. The gap in downtown is about 3 seconds. The capacity for the 3 second gap is 1200 vehicles per hour.
What determines the capacity of a lane group?
According to http://en.wikibooks.org/wiki/Fundamentals_of_Transportation/Traffic_Signals, lane group capacities are calculated by multiplying the adjusted saturation flow rate to the effective green length and dividing this value by the cycle length. Some factors that can affect capacity are lane width, signal phasing, weather, construction, and speed limit. For example: The greatest number of cars passing through the intersection during green time was 10. The green time was 20 seconds and the total cycle length was 70 seconds. Therefore there was a maximum of 10 cars for every 20 seconds or one car every two seconds, giving a saturation flow rate of 1800 vehicles per hour. The saturation flow rate multiplied by 20/70 gives a capacity of 514 vehicles per hour.
What effect does phasing have on capacity?
Each time there is a phasing change, time is lost. There must be all red time to make sure that all vehicles make it through the intersection. More phases mean that there is less green time for the approaches. Less green time means that the lanes with higher volumes are not able to clear the intersection causing more congestion. An example of phasing’s effect on capacity follows: The saturation flow rate of single lane at an intersection is 1400 vph. If there is 30 minutes of green time per hour for one approach during saturated flow than the capacity of that lane is approximately 700 vph.
When is more green time not desirable?
Increasing green time could be detrimental for a highly congested intersection. The increased green time means that there are longer wait times which can lower the level of service. The longer the green time the greater the likelihood of larger headways. If the headways are not kept short then the capacity of the roadway will decrease which, in turn, leads to an overall inefficiency in the system. A simple example of this cause- and-effect scenario follows: If it takes 20 seconds for a queue to clear out in a single intersection approach during saturated flow conditions, and that same approach is given 40 seconds of green time, then the other approaches lose green time making the intersection less efficient.
References
